
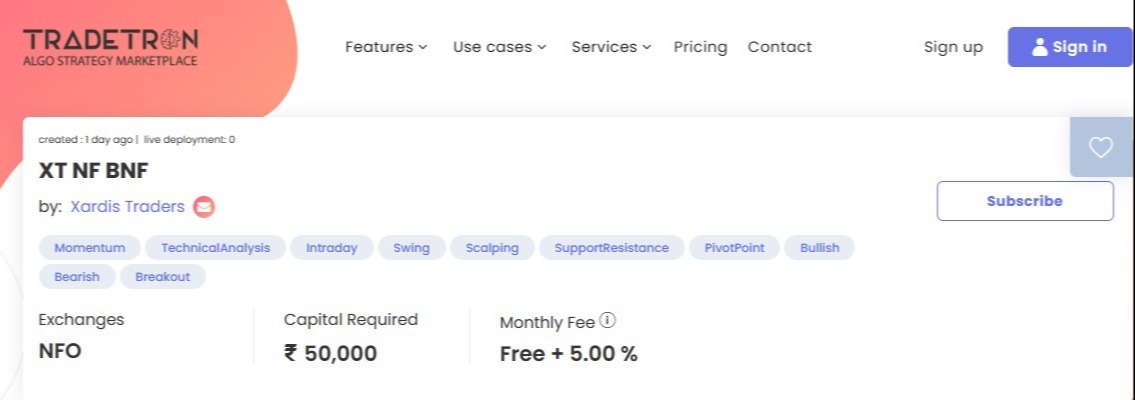


XT NF BNF
XT NF BNF is an ALGO(Automatic) trading strategy for Intraday players to trade in Nifty and Bank Nifty both on NSE India.
No strategy can win every time. XT NF BNF is a time tested ALGO strategy which gives a good return. All you need to have is patience and faith in the strategy.
It will enter trade at 9.20 AM and exit all active trade on the same day at 3.25 PM Indian Standard times. In between it will switch the trades CALL to PUT or Vice-Versa as per the movement of the market.
It will exit if it has reached profit of Rs 3,000/- and again gets reactivated after 15 min.
It takes One Lot of CALL or PUT at the ATM for Weekly Expiry of Nifty and Bank Nifty both. If someone willing for more than one lot then they can use multiplier for the same but remember required fund will also increase as per the multiplier. Maximum multiplier allowed at present is 5X.
If today is weekly expiry of the Instrument it won't take trade of that particular Instrument.
Once the trading hours are over OR universal exit happens, it gets reactivated on its own after 15 min (If you want to take more risk you can reactivate or Pause by yourself at your own risk), hence its ready again to take trades once the market is open.
To Subscribe to this strategy please click following Link:
· Subscription is Free.
· Monthly charges will be 5% of the total profit made.
· Capital required is INR 50,000
· Invoice will be generated first week of every month.
For any clarification or doubt please WhatsApp on +919868914191
Warning:
· Trading in options is a very high-risk trading.
· As per SEBI study, 9/10 individual traders in option segments incurred losses.
· Almost traders loose around Rs 50,000/- in option segment trading’s.
· Over & above net loss traders also incurred 28% of net trading losses as transaction cost.
· Those making profit, loose around 15% to 50% of such profit as transaction cost.
Statistics
| No | Name | Value |
| 1 | Capital Required | Rs. 40000.00 |
| 2 | Total Trading Days | 19 |
| 3 | Win Days | 12 |
| 4 | Loss Days | 7 |
| 5 | Max Winning Streak Days | 4 |
| 6 | Max Losing Streak Days | 2 |
| 7 | Win Rate | 63.16% |
| 8 | Avg Monthly Profit | Rs. 27762.16 |
| 9 | Total Profit | Rs. 25118.15 |
| 10 | Avg Monthly ROI | 69.41% |
| 11 | Total ROI | 62.80% |
| 12 | Standard Deviation (Annualised) | 116.47% |
| 13 | Sharpe Ratio (Annualised) | 7.15 |
| 14 | Sortino Ratio (Annualised) | 12.13 |
| 15 | Max Profit in a Day | Rs. 7451.00 |
| 16 | Max Loss in a Day | Rs. -4266.75 |
| 17 | Avg Profit/Loss Daily | Rs. 1322.01 |
| 18 | Avg Profit on Profit Days | Rs. 2801.72 |
| 19 | Avg Loss on Loss Days | Rs. -1214.64 |
| 20 | Avg no. of trades (Buy + Sell) per trading day | 7.68 |
| 21 | Max Drawdown | Rs. 4266.75 |
| 22 | Max Drawdown % | 8.70 % |
Daily Summary
| Day | Returns (%) | Max profit | Max loss |
| Monday | 12 | 7188.5 | -4266.75 |
| Tuesday | 6.24 | 3352.5 | -3015.75 |
| Wednesday | 8.19 | 3537.5 | -266 |
| Thursday | 28.73 | 7451 | 240 |
| Friday | 10.03 | 1935.25 | 584.25 |
Month Wise PNL
| Month | Total Trades | PNL (Rs) | PNL (%) |
| Jul, 24 | 146 | 25118.15 | 62.8 |


